
Charger uptime
Follow uptime and session trends by site. See where availability needs attention and use exports for uptime and grant reporting.
visualize by synergEV
See uptime, revenue and utilization across every site. Find the connectors costing you sessions and bring the numbers into your next operations review.
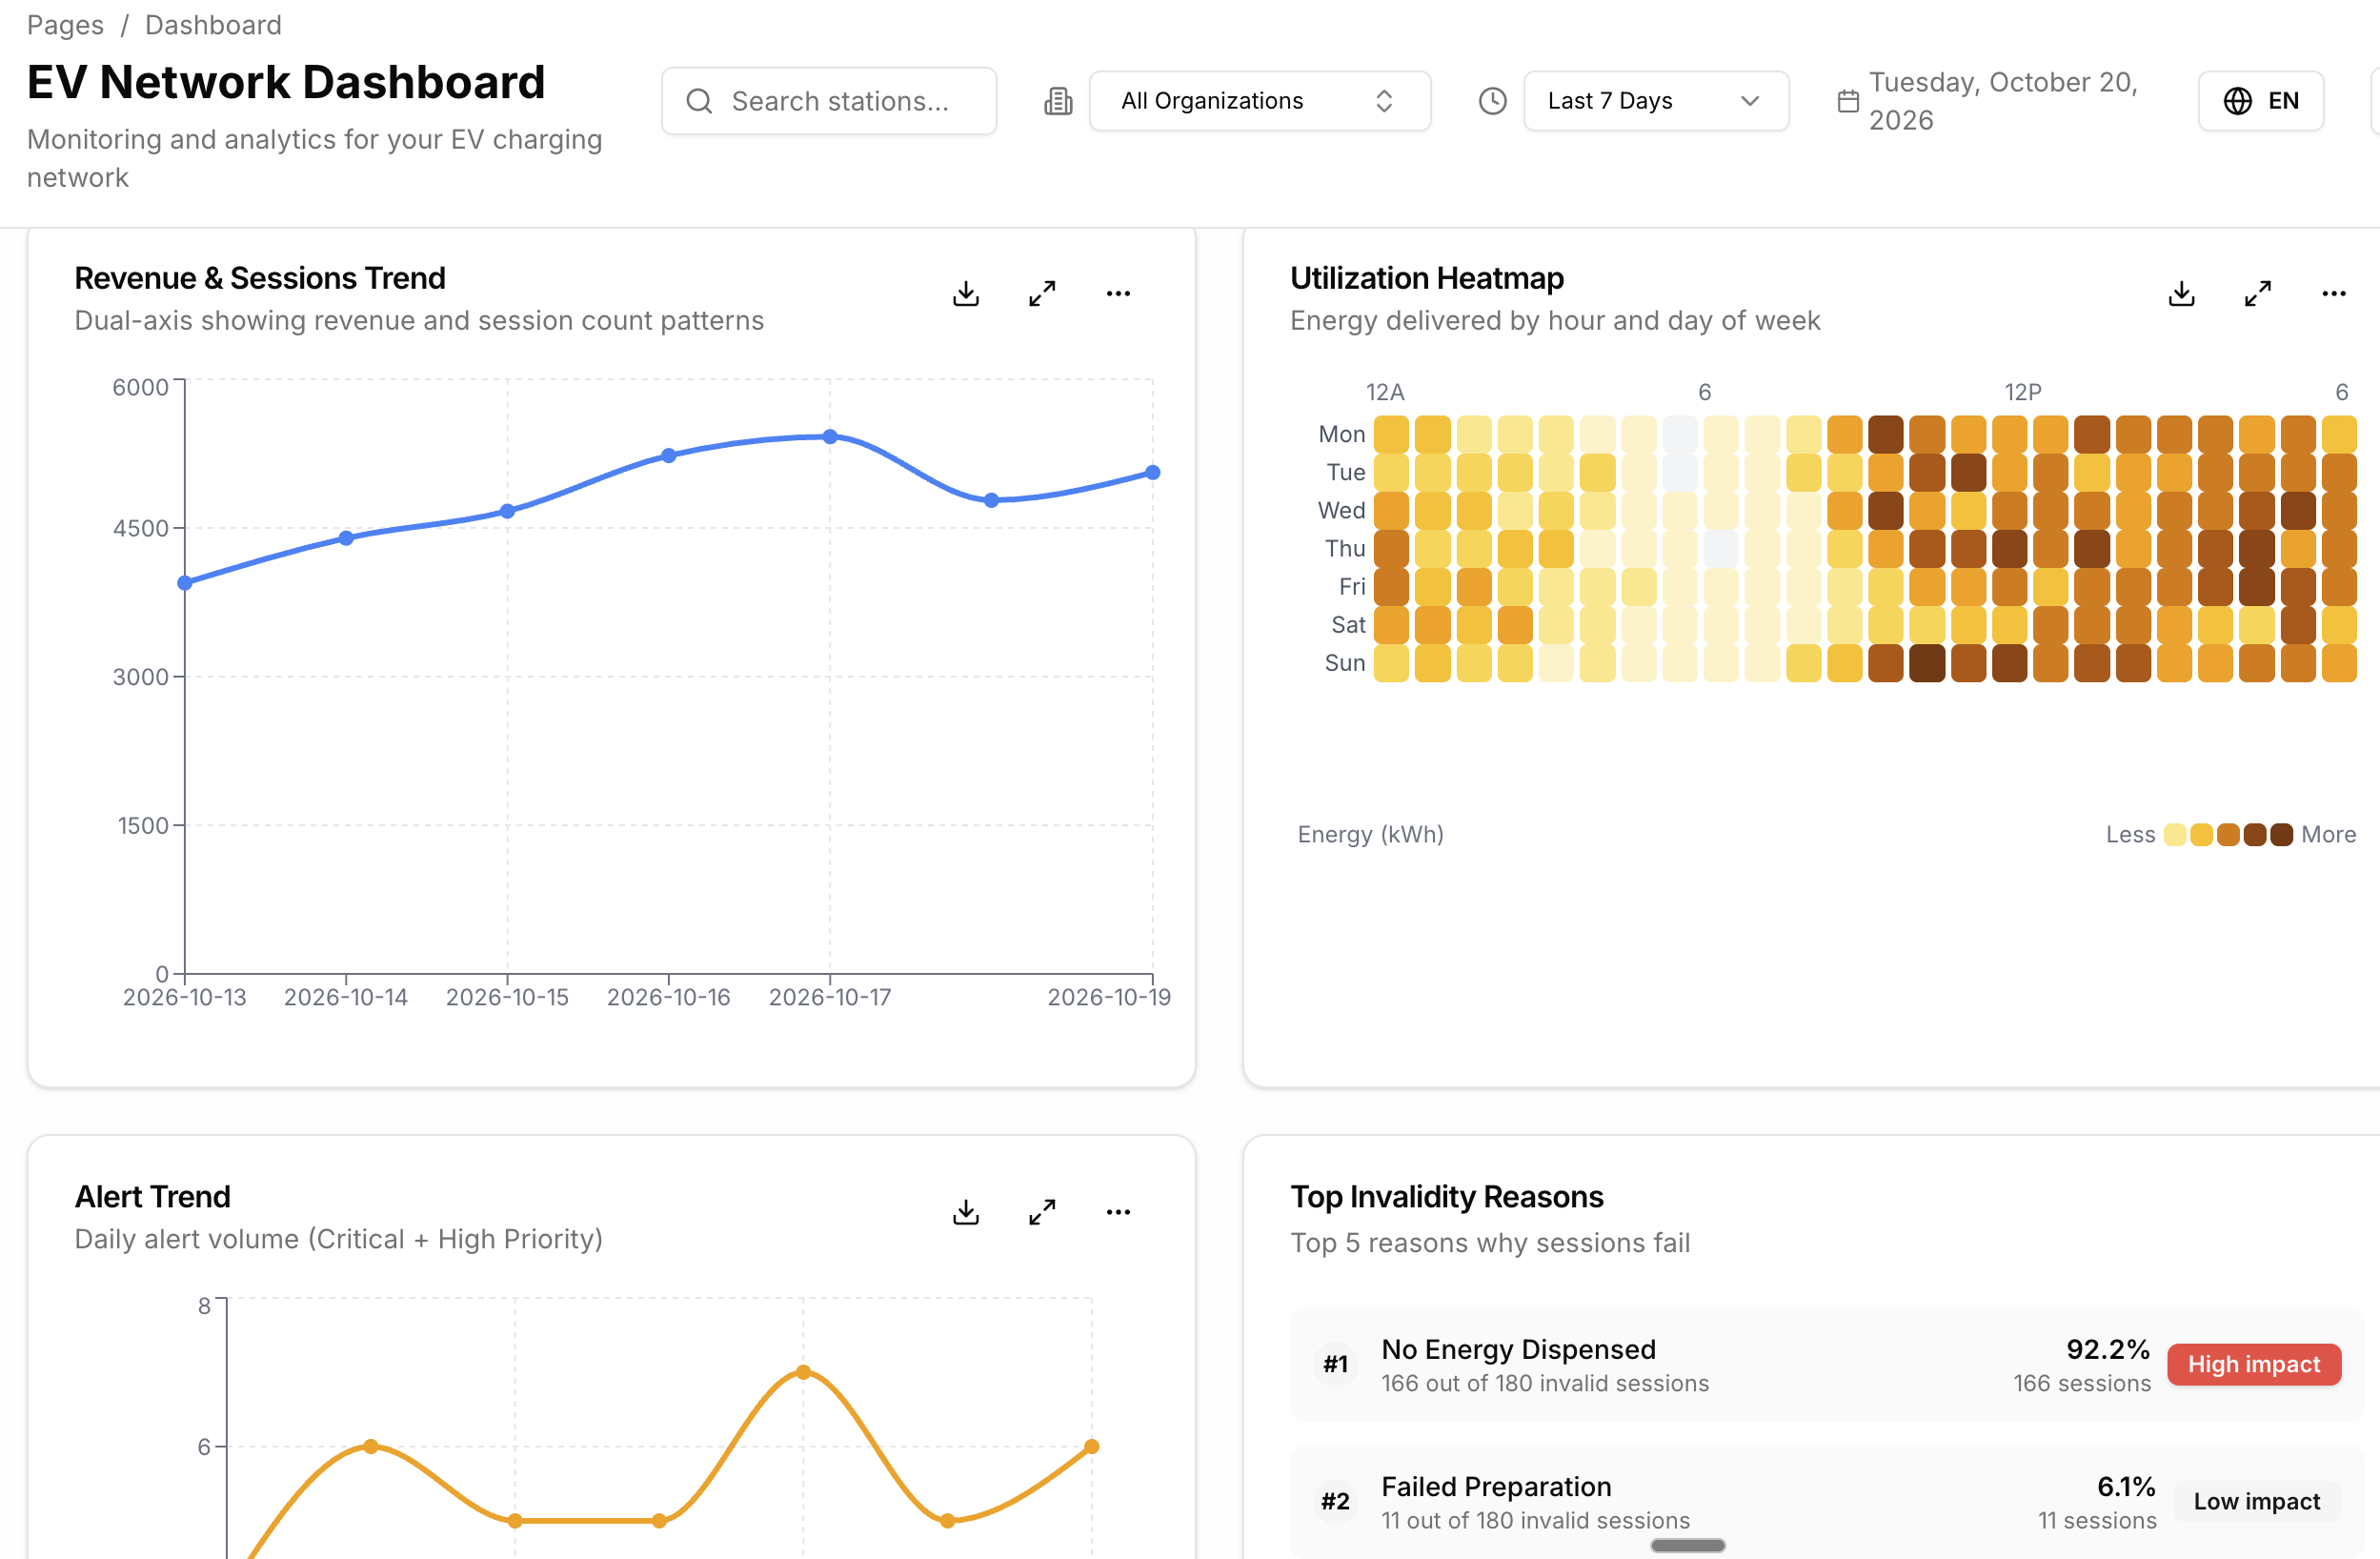
Follow uptime and session trends by site. See where availability needs attention and use exports for uptime and grant reporting.
Review charging revenue, energy delivered and session activity. Compare performance across sites to understand where your network earns revenue.
Explore utilization by hour and day. Identify busy periods and underused stations when reviewing site performance.
Track charging sessions alongside network performance. Use the trends to focus your team's investigation on sites and connectors that need attention.
Start with session exports or connect to your existing charging management platform. synergEV also supports direct OCPP 1.6 connections, so your team can work from the stations and systems it already runs.
Book a 30-minute walkthrough to discuss your stations, data sources and reporting needs.